Education Help with Education Education Resources UNAVCO Educator Packet Field Geodesy Learning Modules & Activities Majors-level undergraduate Introductory-level undergraduate Secondary- Grades 6-12 Data for Educators Tutorials & Handouts GPS Tutorials 3D Imaging Tutorials Geodesy Education Handouts & KMZs Lab Book Links

Exploring plate motion and deformation in California with GPS | Lessons on Plate Tectonics


Index


Goal

Students are able to use Global Positioning System (GPS) data to calculate slip during an earthquake along the San Andreas fault, a transform fault. As an option, they are able to calculate the earthquake’s magnitude.


Context

Audience

This lesson was developed for high school and middle school students, grades 6 - 12. However, its focus on data makes it adaptable for introductory college courses.

Teaching Time

Three class sessions (45 - 55 minutes)

Skills and concepts that students must have mastered

  • Students should be able to use a web browser.
  • Students should be familiar with graphing. If they flounder, the activity “Introduction to graphing GPS data” is designed for novice graphers.

How the lesson is
situated in the course

This lesson can be used at any time in an earth science class. However, in the sequence of lessons about plate tectonics, it fits best during activities about transform boundaries, after activities on divergent and convergent plate boundaries.

Next Generation Science Standards

Performance Expectations: MS-ESS2-2, MS-ESS3-2, and HS-ESS2-1.

Objectives

Students will be able to:

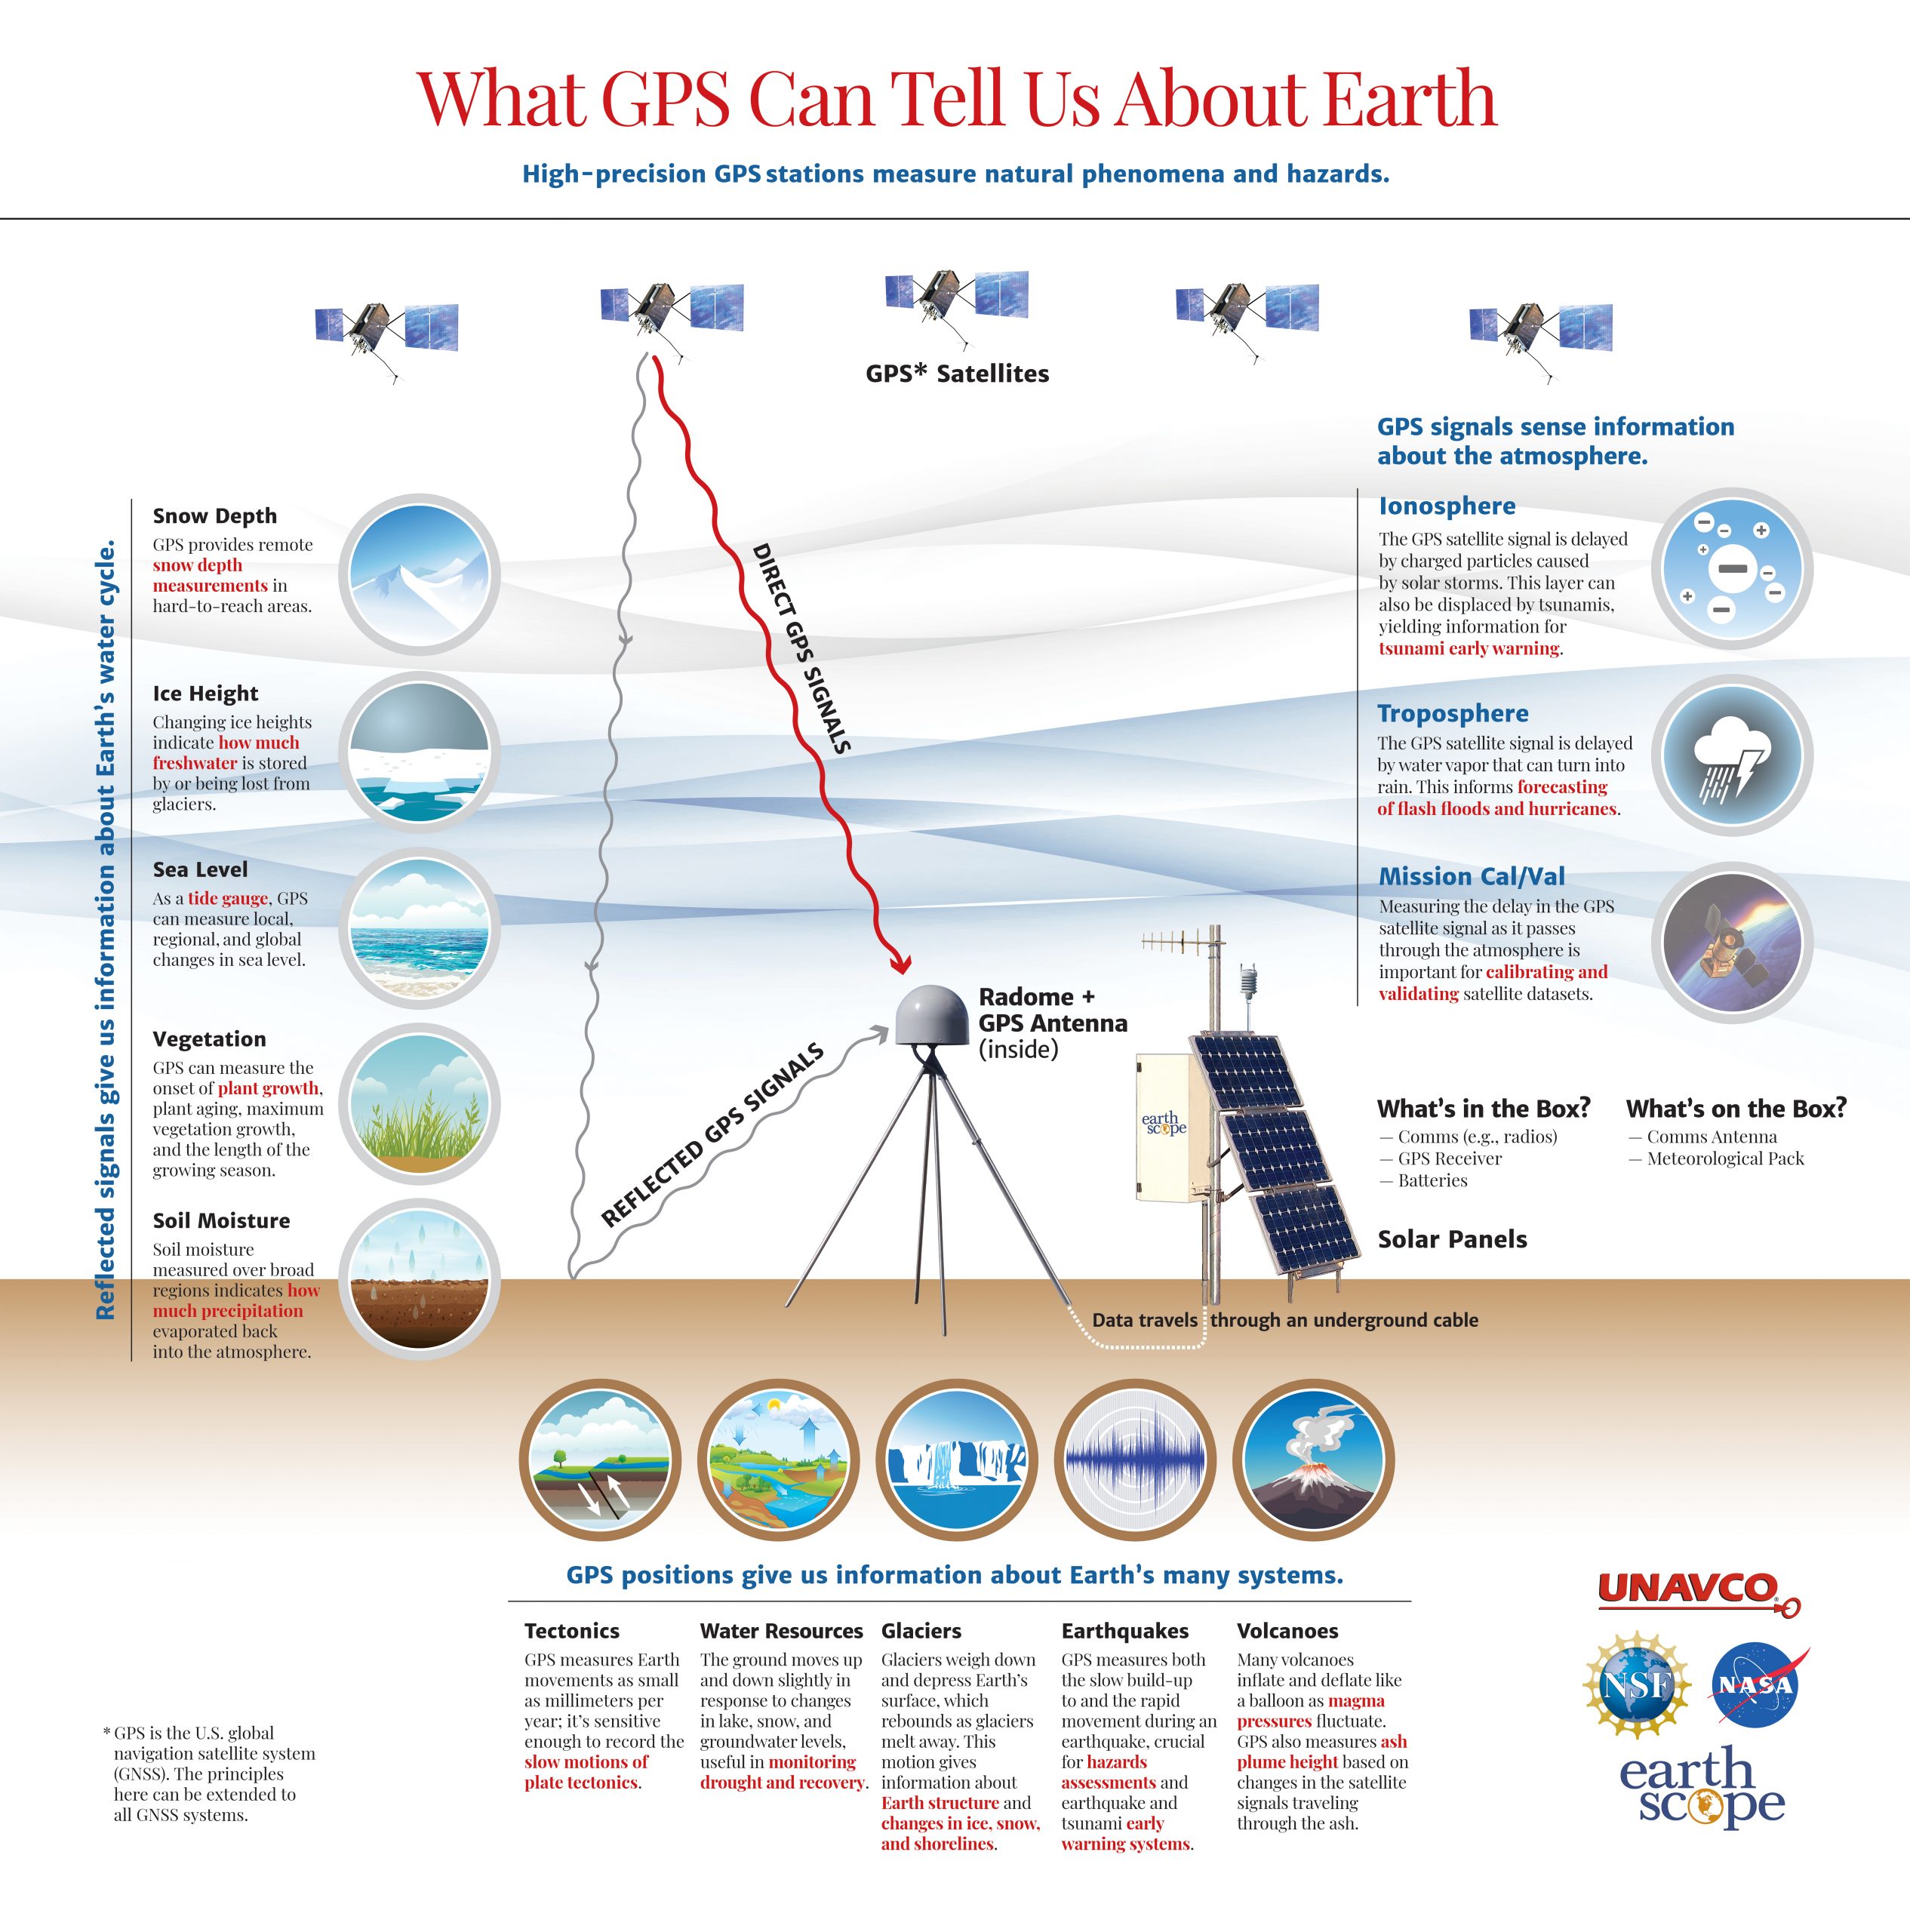
  • Model and describe the general set up of a GPS—how monuments receive signals from multiple satellites
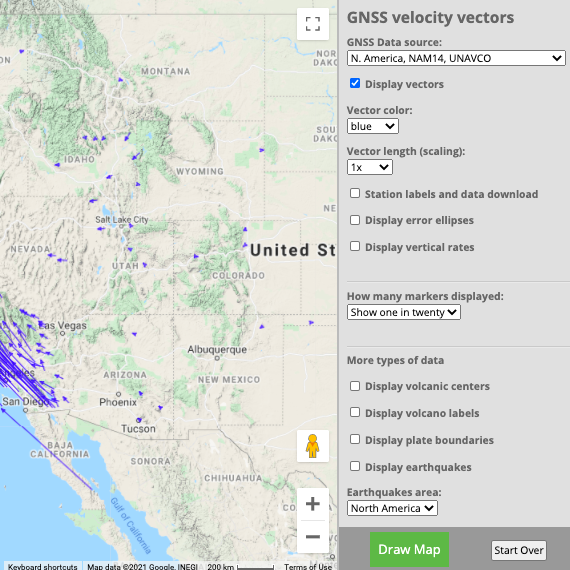
  • Interpret time series plots (position vs. time) qualitatively and quantitatively and represent time series data as velocity vectors, to scale, on a map
  • Add vectors graphically to create a total horizontal velocity vector
  • Discuss relative movement of the Pacific and North American plates in California, using GPS data
  • Calculate the amount of slip along a fault using GPS time series data
  • Calculate the magnitude of an earthquake based on the slip on a fault (optional).

Summary

Students analyze data to study the motion of the Pacific and North American tectonic plates. From GPS data, students detect relative motion between the plates in the San Andreas fault zone--with and without earthquakes. To get to that discovery, they use physical models to understand the architecture of GPS, from satellites to sensitive stations on the ground. They learn to interpret time series data collected by stations (in the spreading regime of Iceland), to cast data as horizontal north-south and east-west vectors, and to add those vectors head-to-tail.

Students then apply their skills and understanding to data in the context of the strike-slip fault zone of a transform plate boundary. They interpret time series plots from an earthquake in Parkfield, CA to calculate resulting slip on the fault and (optionally) the earthquake’s magnitude.

Before starting this lesson, the Introductory lesson: Measuring plate motion with GPS, Part 1 is suggested to learn the basics on how GPS works.

This lesson has an optional prequel, “Introduction to graphing GPS data,” designed for students who cannot yet graph earth science data skillfully or confidently. Its first two parts teach students to graph position vs. time, and its last part dovetails with this lesson. It teaches about velocity vectors by graphing position data over five years.

Organization

This lesson consists of four main parts, the first two coming from a companion lesson.

  1. Modeling GPS stations (or “monuments”) and the satellite network that feeds time signals to the monuments. From “Measuring plate motions with GPS.”
  2. Making sense of GPS data: Understanding time series data in order to develop total horizontal velocity vectors. Also from “Measuring plate motions with GPS.”
  3. Interpreting the vectors in the context of the strike-slip boundary between the Pacific and North American plates.
  4. Inferring an earthquake near Parkfield, CA from GPS time series data.

Download Materials

Teacher materials


All teacher and student files bundled

81 MB • v: April 16, 2014


Individual files:

Teacher guide for Lesson: Exploring plate motion and deformation in California with GPS. [pdf]

[docx]

14 MB • v: April 16, 2014


Presentation: Exploring plate motion and deformation in California with GPS [pdf]

[pdf]

8 MB • v: April 16, 2014

This PowerPoint accompanies the lesson.


Student materials

Student Worksheet for Lesson: Exploring plate motion and deformation in California with GPS [pdf]

[docx]

14 MB • v: April 16, 2014


Data in this Resource

Introductory lesson: Measuring plate motion with GPS, Part I only

Before starting this lesson, the Introductory lesson: Measuring plate motion with GPS, Part 1 is suggested to learn the basics on how GPS works.

Prequel activity: Introduction to graphing GPS data

This lesson has an optional prequel, “Pure and simple graphing GPS data,” designed for students who cannot yet graph earth science data skillfully or confidently. Its first two parts teach students to graph position vs. time, and its last part dovetails with this lesson. It teaches about velocity vectors by graphing position data over five years.


Module Development

This work is based on materials provided by the UNAVCO Education and Community Engagement Program, and the GAGE Facility supported by the National Science Foundation (NSF) and National Aeronautics and Space Administration (NASA) under NSF award: EAR 1261833, and the American Recovery and Reinvestment Act. Authors are Cate Fox-Lent (UNAVCO), Andy Newman (Georgia Institute of Technology), Shelley Olds (UNAVCO), and Nancy West (Quarter Dome Consulting).


Last modified: 2020-04-18  01:47:35  America/Denver