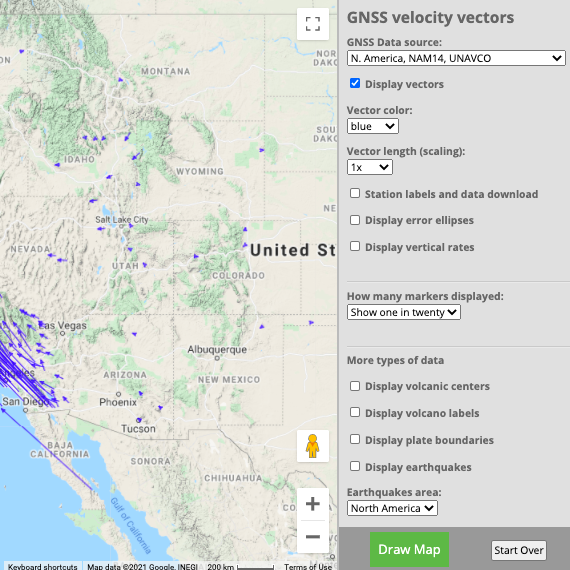
During this demo, participants use springs and a map of the Pacific Northwest with GPS vectors to investigate the stresses and surface expression of subduction zones, specifically the Juan de Fuca plate diving beneath the North American plate.
Demonstration Length
30 minutes to construct
5 – 20 minutes to demonstrate
Major concepts
The Earth is not always rigid.
The Juan de Fuca and North American plates form a subduction zone in the Pacific Northwest where the Juan de Fuca plate moves beneath the North American plate.
The Juan de Fuca and North American plates are "locked" at the plate boundary, causing the North American plate to be pushed and compressed inland.
The land near the coast, closest to the plate boundary, crunches the most while farther inland, the land crunches less - similar to a spring.
Scientists monitor motion of the land with GPS.
During a large earthquake on the subduction zone, the western edge of the North American plate will spring westward.
Supplies
Option 1
1 compression spring (4-8 inches in length & easily compressible)
Ribbons
Printed map of the Pacific Northwest (11x17 works well), with GPS vectors & plate boundaries clearly visible
Option 2
2 compression springs of equal length (scale to the size of the printed map)
2 dowel rods or sticks (scale to the size of the printed map)
Map of the Pacific Northwest with GPS vectors and plate boundaries clearly visible printed onto stretch fabric (make sure the fabric is strectched when first adhering the map)
Approx. 10 twist ties
Stickers
Transparency film
Tape
Instructions for assembly
Option 1
Place the spring on top of the map so that the left side of the spring aligns with the plate boundary and the right side of the spring points inland. Tape the right edge of the spring to the map.
Tie ribbons at three different places on the spring: at the plate boundary, about 100 km inland, and near, but not at, the right side of the spring.
Option 2
Connect the dowel rods or sticks and the springs to form a box, such that the springs form two opposite sides of the box and the sticks form the other two opposite sides of the box.
Attach the map printed on the fabric to the spring/stick frame with twist ties. Make sure that the fabric is stretched before attaching and that the springs are running east-west and the sticks are running north-south.
Attach the transparency film so that it can be flipped back.
Leading the demonstration
Begin by describing the map to the participants - the plate boundaries, how subduction works, GPS vectors.
If using Option 2, have participants place GPS stickers on both the cloth map and transparency film.
Ask the participants to compress the spring (from left to right like the Cascadia subduction zone) and observe how this alters the map/ribbon. Encourage them to compress the spring and let it go multiple times.
Lead the participants through questions to discuss the major concepts of the demo.
Sample questions to consider
Where does the map/ribbon move the most? Where does it move the least?
What happens when you let go of the spring? What does this simulate?
How do you think we can measure this motion?
Given your observation of the motion, how does this relate to the GPS vectors?
In this activity, students learn about subduction of the Juan de Fuca plate beneath the North American plate and how this generates, at times, large earthquakes.
This activity teaches students how to read GPS timeseries, calculate velocities, and analyze what the changing velocities across Cascadia mean for earthquake hazard.